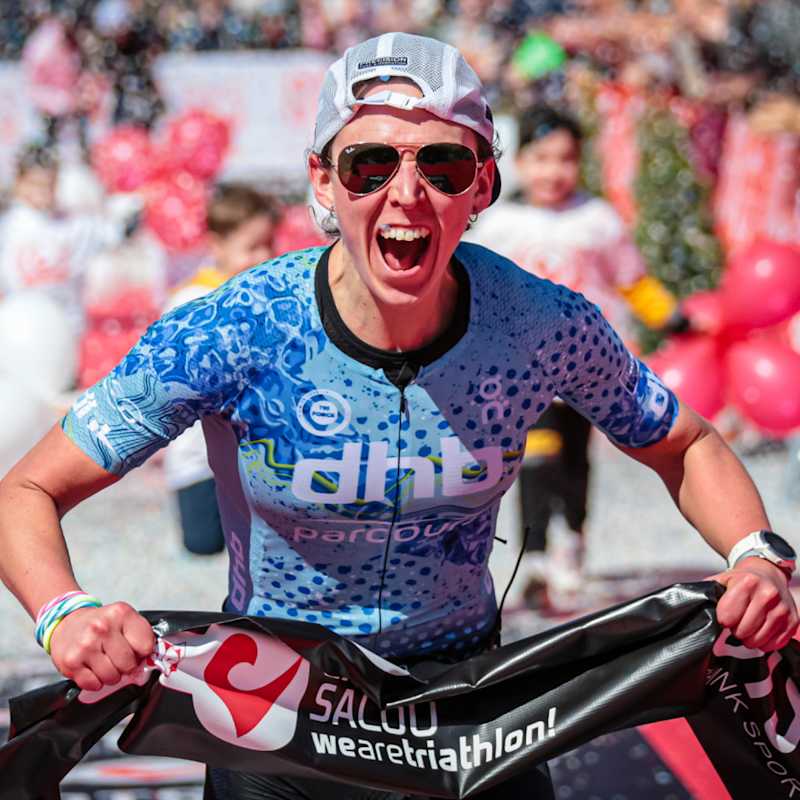
7th
Fenella Langridge's scorecard
IRONMAN Mallorca
Saturday 16th October, 2021
Within recommended ranges
Just outside recommended ranges
Significantly outside recommended ranges
71g
Carb per hour
628mg
Sodium per hour
664ml
Fluid per hour
945mg/L
Relative sodium concentration
5.26mg/kg
Caffeine per bodyweight
How Fenella hit those numbers
How Fenella's hydration and fueling went...
- Fenella had a tough race at IM Mallorca on the 16th October, coming in 7th in a time of 9 hours and 16 minutes. The race didn’t go to plan on the day with a dropped bottle, back pain and dips in energy and motivation. Fenella said ‘it was a difficult day’ and rated her race satisfaction as a 3 out of 10
- After a ‘high volume of racing and traveling’, she feels that the race was ‘average, not bad but not what I am capable of’. Fenella planned to use her solid hydration and fuelling strategy which she is accustomed to, however she lost one bottle and struggled to pick up from the limited aid stations throughout
Hydration
- On average, Fenella drank ~664ml/23oz of fluid per hour across the race, on the bike this consisted of two 750ml pre-mixed bottles, one 750ml/25oz bottle of plain water, two 750ml/25oz bottles of energy drink and on the run this was two ~250ml pre-mixed bottles and ~12 cups of water from aid stations. This volume is almost identical to her fluid intake at Challenge Roth in very similar conditions
- Although we do not have any sweat rate data from Fenella, this seems to be an adequate amount of fluid replacement based on prior experience. This time she did not mention feeling thirsty and she reported peeing a couple of times, as would be expected, which suggests that she did not under hydrate. She rated her hydration strategy as a 7 out of 10, agreeing with our views by saying that ‘even after dropping a bottle I was able to maintain good fluid intake’
- In terms of sodium, Fenella consumed ~628mg/hr. In relation to the volume of fluid she was drinking this equates to a relative sodium concentration of ~945mg/L. Higher than at Roth (~886mg/L), she will have been replacing a greater proportion of her high sweat sodium losses (1,331mg/L). Considering she dropped a bottle containing PH electrolyte tablets this is a decent intake of sodium and she said having a ‘personal bottle on the run meant I could consume some more electrolytes’
Fueling
Quick Carb Calculator Recommendation
30g
carb 30 mins before
60-90g
carb per hour during
- As Fenella has done before previous races, she ate a breakfast high in carbohydrate and met the Quick Carb Calculator’s recommendation of 30g carb 15 minutes before the start of the swim by consuming a PF 30 Energy Gel. These will have topped up her fuel stores well prior to the race
- Fenella’s intake was greatly influenced by dropping one of her carb and sodium rich bottles during the bike leg, but she still drank her other bottles, and had a range of gels and chews. As a result, she consumed an average of ~71g carb per hour; this was a higher ~86g/hr on the bike and ~59g/hr on the run. By adjusting slightly and picking up some on course products she was able to reach our recommended carb range (60-90g/hr)
- We know from previous races Fenella can successfully tolerate really high carb intakes pushing 90g/hr (~84g/hr at Challenge Roth), therefore picking up a few extra gels may have been beneficial, especially on the bike, to hit those higher numbers. Fenella did mention that unfortunately she missed a few energy drink bottles at aid stations which would have increased her intake
- She experienced no GI issues as would be expected considering we have seen her hit very high numbers while maintaining GI comfort previously. She rated her energy levels as a low 2/3 out of 10 stating that she felt some ‘real highs and lows’. Fenella’s carb intake was at a decent amount but considering she is used to an even higher intake (~113g/hr on bike at Challenge Roth) then this could link to her energy dips. In addition, Fenella has had a big season with lots of racing and travelling so an element of residual fatigue may plausibly have influenced how she was feeling during this final race of the season as well
- Fenella had coffee before the race and consumed a couple of caffeine gels on both the bike and the run. This meant during the race she had a total of ~300mg caffeine which equates to 5.26mg/kg body weight. This is a good moderate/large dose which falls within the recommended caffeine intake for performance of 3-6mg/kg body weight
Conclusions
- Overall, Fenella pushed through back pain and lows in motivation to finish IM Mallorca in 9 hours 16 minutes. Despite losing a bottle on the bike, she was able to achieve decent numbers, especially in terms of fluid, by picking up various energy drinks and water from on-course aid stations
- We know Fenella can achieve high carb numbers, she hit over 80g/hr on average and over 110g/hr on the bike at Challenge Roth, so if possible picking up a few more gels on the bike to replace the lost bottle and push towards the top end of the recommended range may have helped her keep her energy levels up aiding her performance. But, in this instance, we must consider that fuelling and a lack of energy were not necessarily the main limiting factors, and take into account the big season that Fenella was coming to the end of
Key info
Fenella Langridge
Female
57kg
Sweat sodium concentration
1331mg/L
Sweat sodium classification
Very High
* determined by a PH Advanced Sweat Test
Result
Position
7th
Overall Time
9:16:27
Swim Time
0:49:24
Bike Time
5:01:51
Run Time
3:20:06
Event information
Sport
Triathlon
Discipline
Full distance
Event
IRONMAN Mallorca
Location
Alcudia, Mallorca
Date
16th October, 2021
Website
Swim Distance
3.8km / 2.4mi
Bike Distance
180.2km / 112.0mi
Run Distance
42.2km / 26.2mi
Total Distance
226.2km / 140.6mi
Bike Elevation
1920m / 6,299ft
Race conditions
Weather Conditions
Hot
Precipitation
No Rain
Min Temp
14°C / 57°F
Max Temp
23°C / 73°F
Avg Temp
20°C / 68°F
Humidity
64%
Athlete feedback
Race Satisfaction
3/10
Hydration rating
7/10
Even after dropping a bottle I felt I was able to maintain good fluid intake
Energy levels
3/10
Some real highs and lows
Toilet stops
Yes
Two short pees and one longer pee on the bike
GI comfort
9/10
Cramping
Twinges but not full-on cramps
Fenella's Thoughts
I feel race performance is down to high volume of racing and traveling. The race itself was just average, not bad and not what I am capable of.
Fenella's full stats
Carbohydrate (g) | Sodium (mg) | Fluid (ml) | Caffeine (mg) | Relative sodium concentration (mg/L) | |
---|---|---|---|---|---|
Overall | |||||
Total intake | 656 | 5,820 | 6,161 | 300 | 945 |
Per hour | 71 | 628 | 664 | 32 | |
Bike and Run | |||||
Total intake | 626 | 5,820 | 6,161 | 300 | 945 |
Per hour | 75 | 696 | 736 | 36 | |
Bike | |||||
Total intake | 431 | 3,024 | 3,850 | 150 | 785 |
Per hour | 86 | 601 | 765 | 30 | |
Run | |||||
Total intake | 196 | 2,797 | 2,311 | 150 | 1,210 |
Per hour | 59 | 839 | 693 | 45 |
Data Confidence
1
2
3
4
5
There is an adequate level of accuracy in the data collected and the numbers reported. The athlete manages to recall what they ate and drank including most specifics (brands, flavours, quantities, plausible estimations of volumes). However, there are estimations made within the data which affect the overall confidence level in the data reported.