< Back to case studies
Pro
2nd

John Borstelmann's scorecard

The Mid South Gravel Race

Saturday 11th March, 2023

Within recommended ranges

Just outside recommended ranges

Significantly outside recommended ranges

  • 110g

    Carb per hour
  • 905mg

    Sodium per hour
  • 701ml

    Fluid per hour
  • 1,291mg/L

    Relative sodium concentration
  • 6.36mg/kg

    Caffeine per bodyweight
  • How John hit those numbers

    finish
    star
    bottle
     
    500ml x PH 1500 (Tablet)
    1 x Cinnamon raisin bagel with cream cheese
    2 x Danish style pastries
    3 x Mini blueberry muffins
    1 x Small tangerine
    355ml x Plain water
    500ml x Black coffee
    180ml x Espresso
     
     
    1 x PF 30 Gel
     
     
    2.6L x PH 1000 (Drink Mix)
    600ml x PF Carb & Electrolyte Drink Mix
    1 x PF 30 Gel
    4 x PF 30 Caffeine Gel
    2 x Energy chew packet with electrolytes (48g carb, 200mg sodium)
    2 x Energy chew packet with caffeine (38g carb)
    250ml x Electrolyte drink mix (220mg sodium, 75mg caffeine)
    1 x Energy bar (19g carb)
     

    How John's hydration and fueling went...

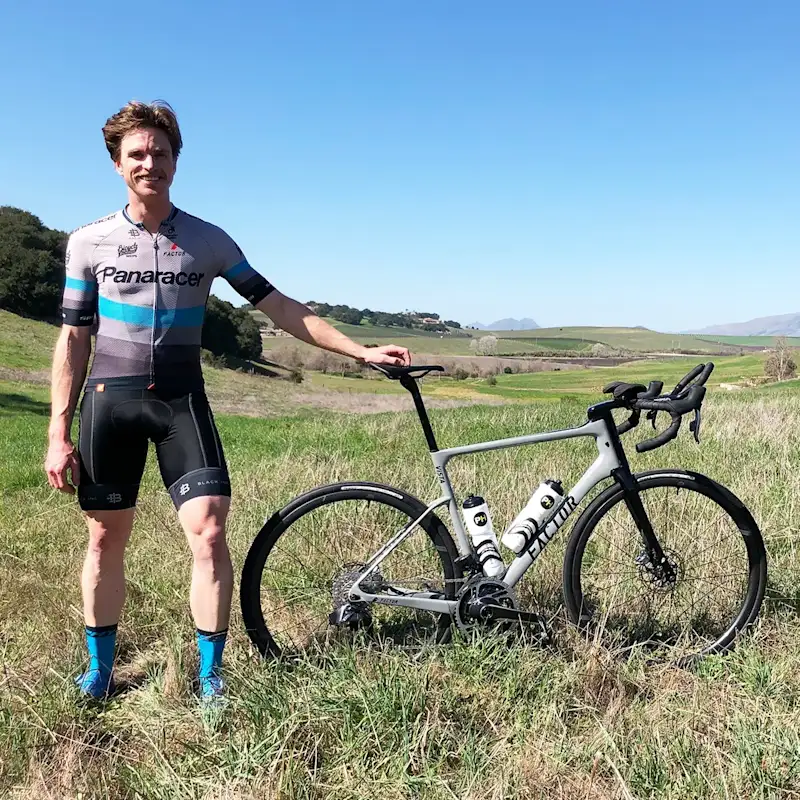
      • John returned to Oklahoma for his third Mid South Gravel race to claim his best spot yet - placing 2nd after another thrilling, muddy 100 miler that once again ended in a sprint finish
      • With 12 months more experience under his belt, an optimised, well-tested fuel and hydration strategy and his signature ponytail, John excelled to finish 19 minutes quicker than in 2022
      • The main difference in his nutrition from 2022 to 2023 was a more concise strategy that allowed him to significantly increase his average carbohydrate intake from ~76g/h to ~110g/h!

    Hydration

      • We’ve seen John consume a range of fluids in the morning of previous races, this time was slightly more streamlined with an espresso and a black coffee to get some caffeine on board in an attempt to harness some of its performance-enhancing qualities, ~355ml (12oz) of water and ~500ml (16oz) of PH 1500 in a effort to start optimally hydrated
      • To avoid the plain water diluting the relative sodium concentration he was taking on board before the race, John could have gone without the additional water as it may have negated the hyper-hydrating effects of pre-loading
      • During the four and a half hour race, John drank an average of ~701ml (21oz) per hour. This mainly came in the form of PF 60 Drink Mix and PH 1000
      • Overall his fluid intake was ~24% higher than during the cooler conditions at last year’s Mid South race where John’s sweat losses would likely have been lower
      • John did not pee during the race, but reflecting on his strategy he would have started with some bigger bottles because he found himself dragging out his bottles to last him to the feed station. Therefore, he may have benefitted from slightly more fluid early on in the race; it would be beneficial for John to undertake some sweat rate data collection to get a handle on whether the level of fluid he is drinking is replacing a good proportion of his sweat losses at race intensity or not
      • The electrolytes within his bottles provided him with a relative sodium concentration of ~1291mg/L, which is around 2-3 times the strength of most commercially available effervescent electrolyte tablets. For John, this concentration is entirely appropriate, due to the fact that he loses 1310mg/L (mg/32oz) as found by doing a Sweat Test, and he was replacing a good proportion of his electrolyte losses
      • Despite doing his best to prevent the onset of electrolyte related cramping with an individualised hydration strategy, John experienced cramping from around 2 hours 45 minutes into the race
      • Many factors have been linked to the onset of cramp, including electrolyte depletion and neuromuscular stimulation and fatigue. With a normalised power of 334W over the race, John ‘raced hard from the gun’ and admitting he hadn’t done much high intensity training prior to his first race of the season, the high muscle demand and therefore fatigue could have played a role
      • With temperatures spiking at 28℃/82℉, not drinking as much as he felt he needed to early in the race, alongside his high sweat losses, could have meant John was dehydrated which potentially played a key part in his cramping. Therefore, it is crucial John undertakes some sweat rate data collection to determine the correct fluid intake he should be aiming for in these race conditions

    Fueling

    Quick Carb Calculator Recommendation

    30g

    carb 30 mins before

    60-90g

    carb per hour during
      • A carb-rich breakfast the morning of the race topped up John’s glycogen stores and ensured he was well fueled for a tough day out. Then, an additional PF 30 Gel within the last 30 minutes increased his blood glucose for when the gun went off potentially sparing some of that stored energy for use later in the race
      • John ensured he got enough carb in during this race, while not succumbing to ‘flavor fatigue’ by varying the type of products he consumed, this time including mainly PF30 Gels, chews, bars and PF 60 Drink Mix
      • This intake resulted in him having an impressive ~110g/h, which is 44% more per hour than he consumed during the very same race the year prior. He was happy to report that despite achieving this while holding such a high pace throughout, he rated his stomach comfort a perfect 10 (out of 10), saying he would have easily had an extra gel or two if he’d thought to pack them instead of the ‘cheese cracker sandwiches’ which were left uneaten
      • This increased carb intake also meant he was able to rate his energy levels a 9 (out of 10) in 2023, compared to a 7 in 2022. The general scientific consensus is that increased carbohydrate availability is associated with improved performance (unless impeded by stomach discomfort), and so this higher perceived energy may also be indicative of his physical output on the day
      • Another factor which would have influenced his perceived effort, is how well he utilised caffeine. Through the use of PF 30 Caffeine Gels he was able to have ~6.4mg per kilogram of body weight. This is right at the top end of the 3-6 mg/kg general guidelines for performance benefits, and would have helped his mental focus and physical performance

    Conclusions

      • Having significantly increased his carbohydrate intake, and therefore energy levels for the 2023 Mid South Gravel Race, John was very pleased with his podium spot especially given that he was mainly using the race to test his legs for the season ahead
      • Going forwards, John can start to nail his hydration strategy by getting an idea of his fluid loss in training, using sweat rate testing
      • Rating his race satisfaction as an 8 (out of 10) he is happy with where his fitness currently is, but felt the win could have been his if he’d paced it a little better, being pipped to the line by just one second
      • We look forward to seeing what John can achieve throughout the rest of this season and if he can improve further to claim the top spot in 2024!

    Key info

    John Borstelmann

    Male
    76kg
    Sweat sodium concentration
    1,310mg/L
    Sweat sodium classification
    High
    * determined by a PH Advanced Sweat Test

    Result

    Position
    2nd
    Overall Time
    4:34:04
    Normalised power (Bike)
    334W

    Event information

    Sport
    Cycling
    Discipline
    Gravel
    Event
    The Mid South Gravel Race
    Location
    Oklahoma, USA
    Date
    11th March, 2023
    Website
    Total Distance
    163.0km / 101.3mi
    Total Elevation
    2,195m / 7,201ft

    Race conditions

    Weather Conditions
    Mild
    Precipitation
    No Rain
    Min Temp
    11°C / 52°F
    Max Temp
    28°C / 82°F
    Avg Temp
    18°C / 64°F
    Humidity
    62%

    Athlete feedback

    Race Satisfaction
    8/10
    Energy levels
    9/10
    Energy levels were good, there was probably a gradual decline throughout the race but no noticeable dips
    Toilet stops
    No
    GI comfort
    10/10
    Stomach comfort was really good. I would have downed another gel or two toward the end if I'd brought any more
    Cramping
    Mild cramps that I could push through

    John's full stats

     Carbohydrate (g)Sodium (mg)Fluid (ml)Caffeine (mg)Relative sodium concentration (mg/L)
    Overall
    Total intake5014,1323,2004831,291
    Per hour110905701106

    Data Confidence

    marker-icon

    1

    2

    3

    4

    5

    There is good confidence in the accuracy of the data reported. An athlete feels that the numbers closely reflect what they consumed despite a couple of estimations which may carry some degree of error. The majority of what was consumed is recorded to a high level of specificity (most volumes are known through the use of bottles brands quantities flavours). The numbers are very plausible and align with previous data recordings (if an athlete has collected data previously).

    John's recent case studies

    see all

    Related case studies

    Nail your next event with a FREE Fuel & Hydration Plan
    Get started