1st
Chris Harris' scorecard
Swashbuckler 70.3
Sunday 10th July, 2022
Within recommended ranges
Just outside recommended ranges
Significantly outside recommended ranges
108g
Carb per hour
780mg
Sodium per hour
605ml
Fluid per hour
1,290mg/L
Relative sodium concentration
2.78mg/kg
Caffeine per bodyweight
How Chris hit those numbers
How Chris' hydration and fueling went...
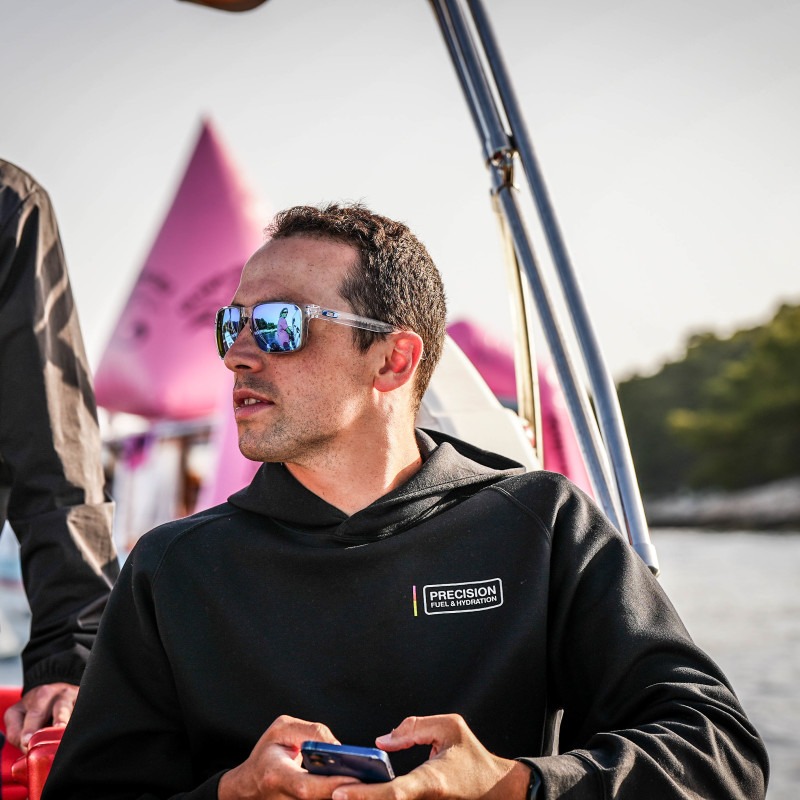
- One of the Precision Fuel & Hydration Sports Science team, Chris AKA ‘Minty’, had a solid race at the Swashbuckler 70.3, securing his first overall race win in a middle-distance triathlon
- The weather forecast predicted hot temperatures, so Chris knew a robust hydration and fueling strategy was essential to ensure he raced to his full potential
- Chris nailed his strategy and finished the race saying “I probably could have carried on a fair bit longer, I had so much energy”. In contrast, he saw several athletes who didn’t get it quite right, with the run course being “littered with people cramping and generally struggling with the heat”
- Chris wore a Continuous Glucose Monitor from Supersapiens which together with the Supersapiens energy band that he carried with him, allowed him to to collect live glucose readings throughout the race
Hydration
- Chris made sure he started the race optimally hydrated by preloading with ~500ml/16oz PH 1500 (Tablet) the night before and the morning of the race. This will have ensured his sodium levels were optimally topped up, meaning his fluid retention and blood plasma volume were maximised, reducing the strain on his cardiovascular system during the race
- During the bike, Chris consumed ~1.25L (42oz) of fluid, which contained ~2,850mg of sodium, giving him an average relative sodium concentration of ~2,280mg/L
- Considering Chris’s sweat sodium concentration is 1,433mg/L, this concentration of drinks may appear a little high, but Chris knew there weren’t many drinks stations on the run course, so treated the bike as an opportunity to preload for the run. In future, Chris could consider reducing his relative sodium concentration on the bike and taking some Electrolyte Capsules with him on the run to keep his sodium intake more stable
- Unfortunately, as Chris neared the end of his first lap on the bike he dropped a 750ml/24oz bottle containing one PH 1500 (Tablet), and as he had just finished his other bottle, this meant he rode the second lap without any fluid. Luckily, he spotted his bottle on the ground as he neared the end of the bike so stopped to pick it up, knowing how crucial hydrating was going to be before starting the run
- Once onto the run, Chris picked up cups of water from the aid stations to drink, and also poured several over his head to keep himself cool as temperatures rose to ~29℃/ 84℉
- In total, Chris drank ~2.62L/92oz of fluid throughout the entire race, averaging ~605ml/20oz per hour. This was split into ~536ml/16oz per hour on the bike and ~913ml/30oz per hour on the run. Usually we’d expect Chris’s fluid intake to be lower on the run compared to the bike, but as the temperatures rose throughout the race, Chris stopped at all six aid stations to ensure he got enough fluid on board
- Chris rated his hydration strategy 7/10, saying “if I had executed my plan it would have been 10/10, but riding for an hour with nothing to drink was sub-optimal”
Fueling
Quick Carb Calculator Recommendation
30g
carb 30 mins before
60-90g
carb per hour during
- Chris carb-loaded the night before the race by having a chicken and spinach pizza, and backed this up by having a carb-rich breakfast consisting of porridge and honey about 90 minutes prior to the race start
- In the last 15 minutes before the swim, Chris took a PF 30 Energy Gel to top off his glucose levels and spare his stored glycogen for later in the race. This was confirmed by his Supersapiens monitor which recorded a significant increase in glucose shortly after taking this initial gel, and supports their suggested strategy for the best time to eat before exercise
- In terms of carb intake throughout the race, Chris averaged an impressive ~108g/h including the 25 minutes he spent swimming, so actually hit ~110g/h on the bike and ~120g/h on the run
- Whilst these numbers are higher than the 90g/h which our Fuel & Hydration Planner recommends, it supports the recent evidence which suggests athletes can absorb carbohydrates at rates of over 90g/h through multiple sources of sugars (e.g. glucose and fructose), and exceed the performance benefits of those taking lower quantities. Chris has, however, spent significant time training his gut to tolerate this quantity of carbs, and is now reaping the benefits
- Chris hit these impressive carb numbers on the bike by filling a ~500ml/16oz bottle with two PF 90 Energy Gels and one PF 30 Energy Gel, before topping the bottle up with ~100ml/3oz of correctly mixed PH 1500 (Drink Mix) to make the gels a bit more fluid, guaranteeing that they came out of the bottle easily
- On the run, Chris carried one PF 90 Energy Gel with a bite valve on top which he sipped on regularly, whilst also taking two PF 30 Caffeine Gels at approximately kilometres 3 and 12. These gave Chris an average caffeine intake of ~2.7mg/kg of bodyweight which is slightly below the 3-6mg/kg recommended range. Chris will still have seen a reduction in his perceived effort in the latter stages of the hilly run course, and he could even consider taking another caffeine hit earlier in the race to fall within the recommended range for boosting endurance performance
- Chris’s glucose levels gradually rose throughout the race, which suggests he was matching his energy outputs with his aggressive fueling strategy
Conclusions
- Chris raced hard from the gun, leading out of the swim and never looking back as he battled solo for the remaining ~4 hours
- This is the highest amount of carbs Chris has hit during a race. Positively, he rated his GI comfort 10/10 which suggests he was comfortably tolerating these carb quantities
- Racing well in the heat is something Chris was always worried about in previous years, as he has a high sweat sodium concentration and a high sweat rate, but having an appropriate and calculated fluid and fuel plan has enabled him to reap the rewards of his training, regardless of the weather conditions
Key info
Chris Harris
Male
72kg
Sweat sodium concentration
1,433mg/L
Sweat sodium classification
Very High
* determined by a PH Advanced Sweat Test
Result
Position
1st
Overall Time
4:20:30
Swim Time
0:25:29
Bike Time
2:20:28
Run Time
1:30:47
Normalised power (Bike)
261W
Event information
Sport
Triathlon
Discipline
Middle distance
Event
Swashbuckler 70.3
Location
Beaulieu, England
Date
10th July, 2022
Website
Swim Distance
1.9km / 1.2mi
Bike Distance
90.0km / 55.9mi
Run Distance
22.6km / 14.0mi
Total Distance
114.5km / 71.1mi
Bike Elevation
502m / 1,647ft
Run Elevation
184m / 604ft
Race conditions
Weather Conditions
Hot
Precipitation
No Rain
Min Temp
21°C / 70°F
Max Temp
29°C / 84°F
Avg Temp
25°C / 77°F
Humidity
66%
Athlete feedback
Race Satisfaction
9/10
Hydration rating
7/10
I dropped a bottle on the bike, if I'd been able to drink throughout this would be a 10/10
Energy levels
10/10
No major dips, felt like I could have kept running if I needed to
Toilet stops
Yes
4km into the run
GI comfort
10/10
Cramping
No cramping
Chris' Thoughts
My first overall 70.3 win on a hilly course in scorching temperatures, I'm pretty stoked!
Chris' full stats
Carbohydrate (g) | Sodium (mg) | Fluid (ml) | Caffeine (mg) | Relative sodium concentration (mg/L) | |
---|---|---|---|---|---|
Overall | |||||
Total intake | 466 | 3,379 | 2,620 | 200 | 1,290 |
Per hour | 108 | 780 | 605 | 46 | |
Bike and Run | |||||
Total intake | 436 | 3,379 | 2,620 | 200 | 1,290 |
Per hour | 114 | 881 | 683 | 52 | |
Bike | |||||
Total intake | 256 | 2,850 | 1,250 | 0 | 2,280 |
Per hour | 110 | 1,221 | 536 | 0 | |
Run | |||||
Total intake | 180 | 529 | 1,370 | 200 | 386 |
Per hour | 120 | 352 | 913 | 133 |
Data Confidence
1
2
3
4
5
There is good confidence in the accuracy of the data reported. An athlete feels that the numbers closely reflect what they consumed despite a couple of estimations which may carry some degree of error. The majority of what was consumed is recorded to a high level of specificity (most volumes are known through the use of bottles brands quantities flavours). The numbers are very plausible and align with previous data recordings (if an athlete has collected data previously).