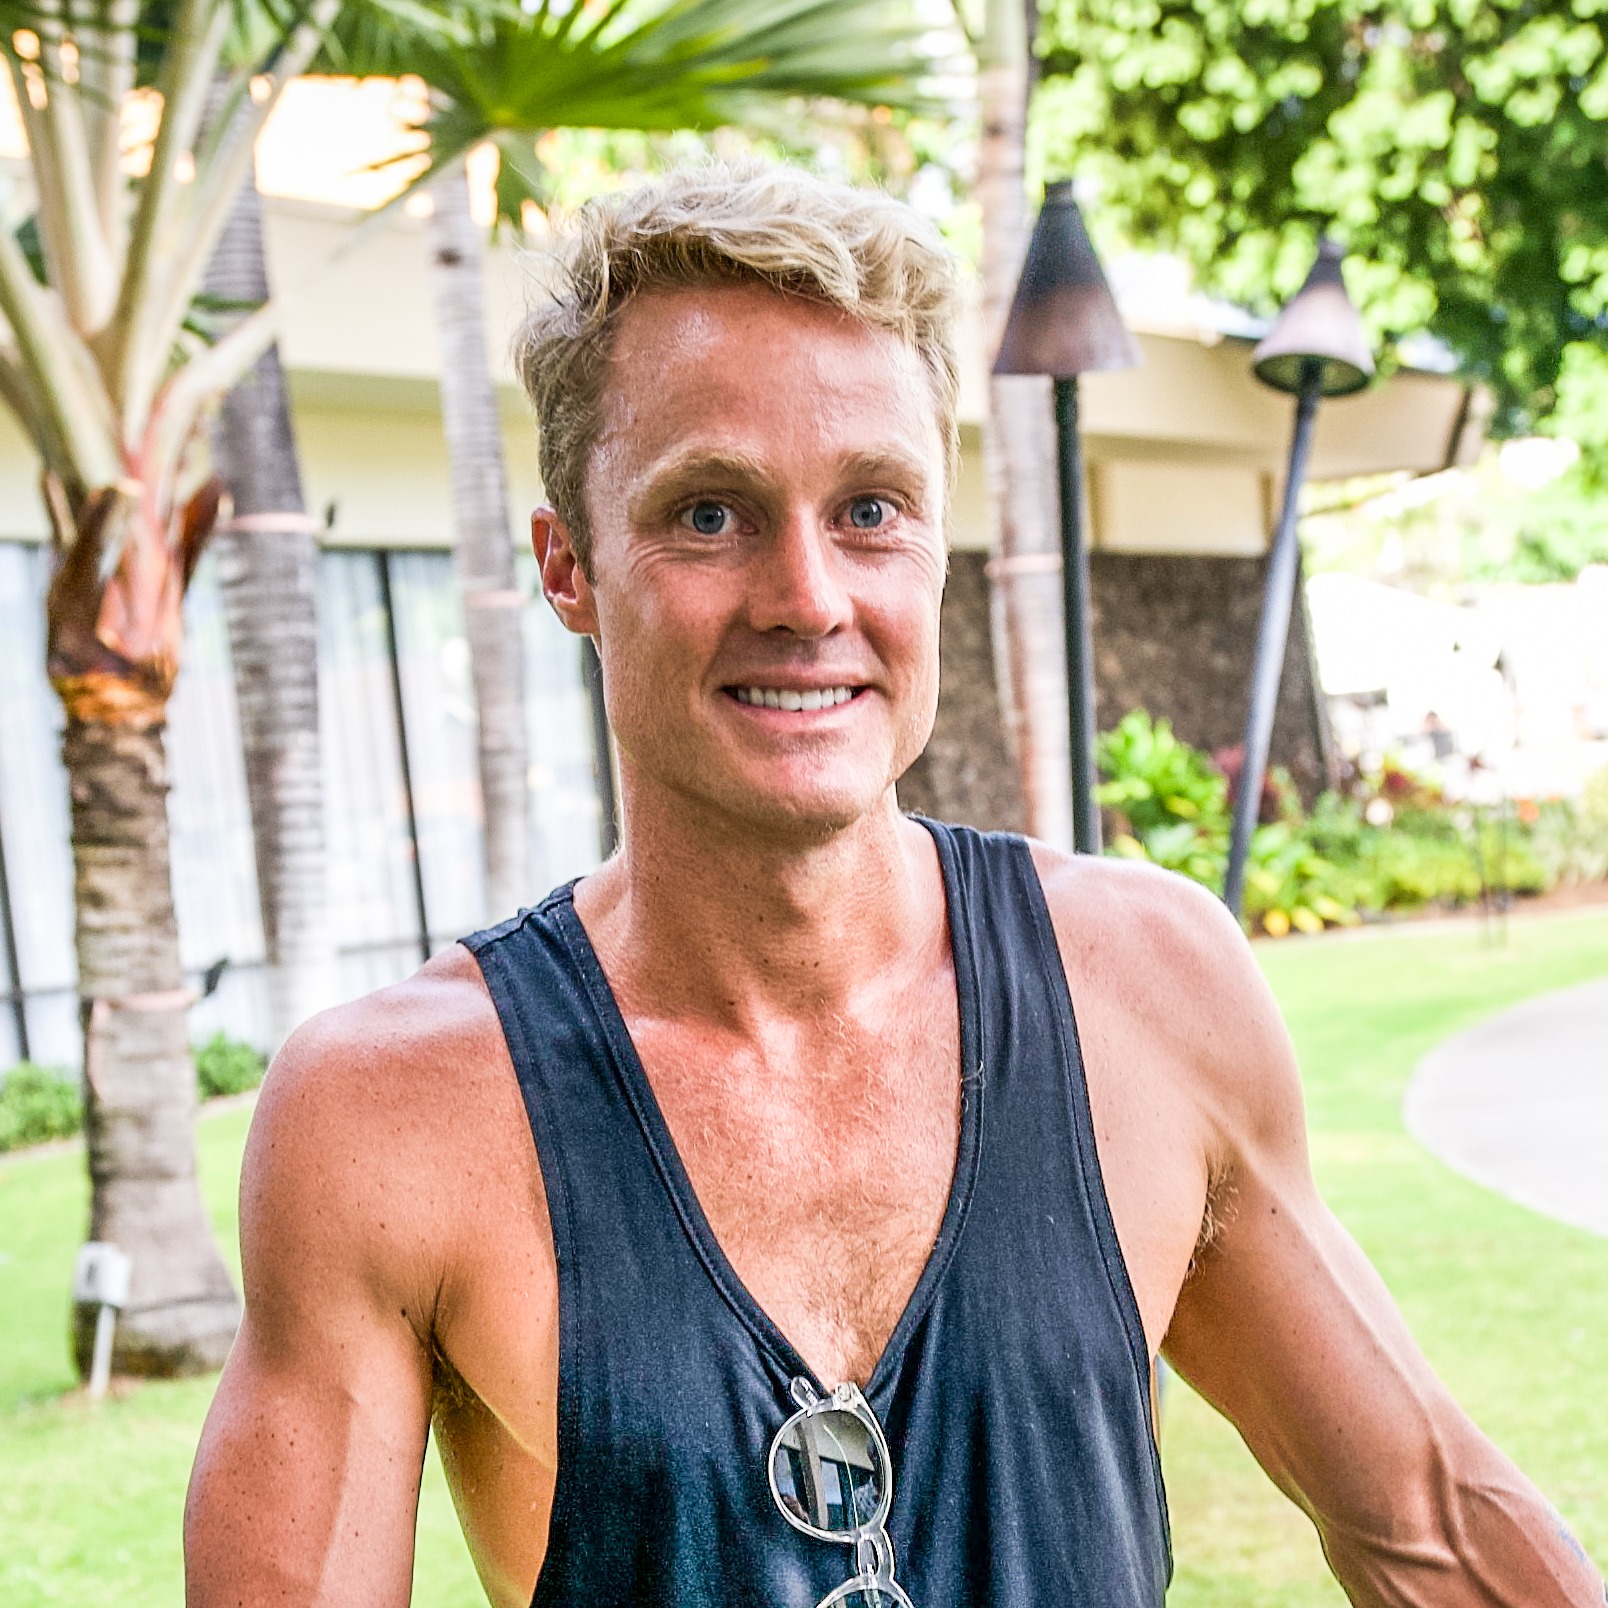
Luke Henderson
IRONMAN® Cairns
Luke's headline numbers
Luke's strategy
Fueling
Carbohydrate is the main fuel you burn when racing. Failing to fuel properly is a leading cause of underperformance in longer races.
As we suggested after his previous two races in Western Australia and Melbourne, Luke could further optimise his pre-racing fueling by including more carbohydrate in the form of fructose (e.g. honey, PF Carb Only Drink Mix) alongside his glucose-based drink mix. Additionally, consuming a final dose of carbs before the swim could help to top up his liver glycogen stores, and increase early carbohydrate availability to delay the depletion of glycogen. During the race, Luke relied on 16 gels to sustain his energy levels, but averaged a lower carb intake than at IRONMAN® Western Australia the year prior. This reduction predominantly came on the bike (~17g less carb per hour), so next time out Luke should look to push back up towards the 90g/h carb recommendation to better support his performance on both the bike and later in the race.
Hydration
Taking on board an appropriate amount of fluid and sodium is essential to maintaining blood volume and supporting the cardiovascular effort needed to perform on race day.
Whilst the absolute amount of sodium and fluid consumed per hour is important, it’s critical to consider these in relation to each other. This is known as 'relative sodium concentration' and it’s expressed in milligrams per litre (mg/L). How much sodium you’re taking in per litre of fluid is more important than the absolute amount taken in per hour.
Sweat sodium concentration (mg/L) is largely genetically determined and remains relatively stable. Knowing how salty your sweat is enables you to replace a good proportion of your sweat losses, which can range from 200-2,000mg/L.
Given Luke’s losses are Very High (2,129mg/L), nailing his hydration strategy becomes especially crucial when it’s hot and/or humid.
Learn moreFluid: Considering his very-high sweat rate and significant sweat sodium losses, and history of hyponatremia in races, Luke once again pushed himself to the limit at IRONMAN® Cairns where average temperatures reached ~24℃ / 75°F. Drinking ~6.2L (210oz) on the bike exceeded the typical recommendations for most athletes. However, Luke, who can lose over 1.5L (48oz) per hour of sweat and has prior experience consuming these higher volumes of fluid, felt this was sufficient and didn’t experience excessive urination, which suggests that this fluid intake was appropriate for him.
Electrolytes: The run leg was where Luke deviated from his previous hydration strategy. Instead of using pre-mixed flasks of PH 1500, he relied solely on Electrolyte Capsules. To support his high sweat sodium losses, Luke had four Electrolyte Capsules every other aid station (a total of 48 capsules!). This equates to ~12,000mg sodium and 6,000mg potassium. So, given that he drank less than he planned, this intake pushed the relative sodium concentration of his drinks above ~3000mg/L, rather than his intended ~2000mg/L. An hour into the run, Luke started to get a ‘tingling sensation’ in his extremities. The most likely explanation of this is the imbalance of electrolytes and his acid-base balance. Consuming such high concentrations of both sodium and potassium can cause the body to shift fluid from other areas, potentially leading to serious health issues. Considering he drank less fluid than he’d planned, Luke should have adapted and reduced his intake of Electrolyte Capsules to keep the relative sodium and potassium concentration to a more reasonable level; this is especially important for someone like Luke who is working with such high quantities to avoid issues to his health, as well as performance.
Caffeine
Beyond the Three Levers of Performance (carb, sodium and fluid), caffeine is one of only a few substances that is proven to improve performance for most endurance athletes as it can help stave off mental and physical fatigue.
Luke’s very high caffeine intake on race day included three caffeine tablets, and two caffeine gels. Such a large dose of caffeine is most likely unnecessary as research suggests that consuming more than 6mg per kilogram of bodyweight provides no additional benefits. At such high doses, the potential negative side effects can outweigh the possible benefits. Reducing his caffeine intake to stay in line with the optimal range could help to minimise these risks while still maximising the potential benefits.
How Luke hit his numbers
Here's everything that Luke ate and drank on the day...
Luke's weapons of choice
Final thoughts
Luke's full stats
Data Confidence?
There is an adequate level of accuracy in the data collected and the numbers reported. The athlete manages to recall what they ate and drank including most specifics (brands flavours quantities plausible estimations of volumes). However there are estimations made within the data which affect the overall confidence level in the data reported.