8th
John Borstelmann's scorecard
Belgian Waffle Ride
Saturday 30th April, 2022
Within recommended ranges
Just outside recommended ranges
Significantly outside recommended ranges
101g
Carb per hour
1,129mg
Sodium per hour
957ml
Fluid per hour
1,180mg/L
Relative sodium concentration
7.08mg/kg
Caffeine per bodyweight
How John hit those numbers
How John's hydration and fueling went...
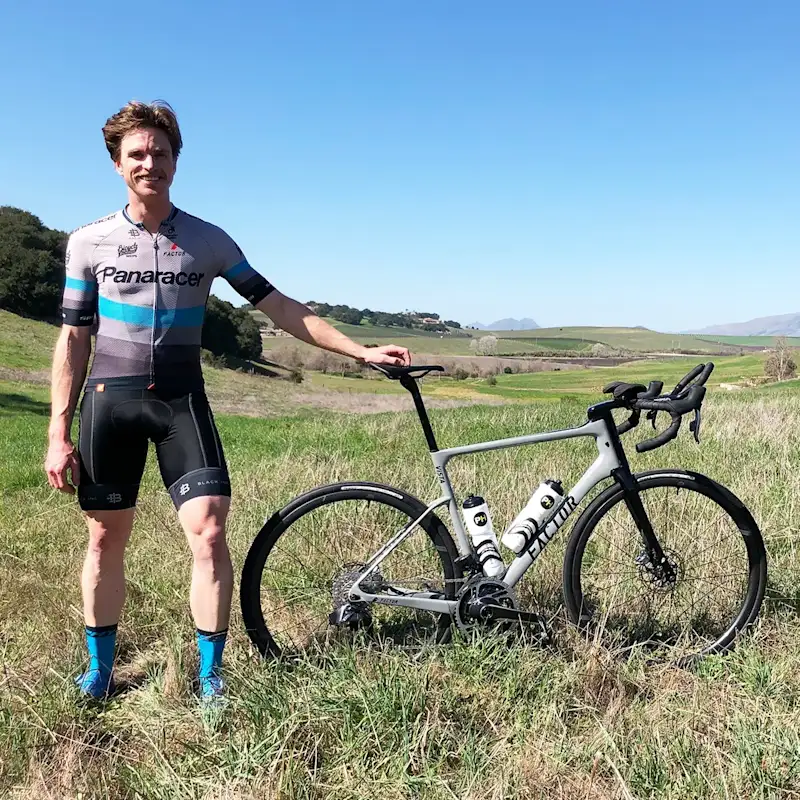
- The 2022 Belgian Waffle Ride California was widely considered to be the most challenging edition of the famous invitation-only event yet, with riders negotiating a brutal 11,000 feet of climbing during the 212km race
- Two-time World Gravels Champion John Borstelmann produced a battling performance to finish in the top-10 despite suffering a mechanical after ~64km that scuppered his chances of sticking with the leading group. As a result, John spent more than three hours riding on his own - as he eloquently put it, “I was solo into the headwind, Simba in the elephant graveyard”
- Whilst John had hopes of challenging for the podium before the race, there were still plenty of positives to take away from the result and how he executed his fueling strategy, not least the fact he hit more than 100g of carbohydrate per hour with no ill-effects
Hydration
- As we’ve seen from case studies of John’s previous races, he tends to consume quite a high volume of fluid in the morning. He preloaded with PH 1500 in 1 litre (~32oz) of water to help ensure he was topped up on sodium, which meant he was boosting his blood plasma volume and aiming to start optimally hydrated
- In future, John might want to consider dialling back his overall pre-race fluid intake slightly and focus on mixing his PH 1500 with ~500ml (16oz) of water. This will help maintain the relative sodium concentration of the PH 1500, which contains 1,500mg of sodium per litre (~32oz) when mixed as directed
- Starting hydrated in California was always going to be important for John as temperatures averaged 24℃/75.2°F, with ~76% humidity on the day, and he did a good job of hitting impressive sodium and fluid numbers during the near-7 hour contest
- Indeed, John has honed his hydration strategy over the last 12 months and has found that he gets good results from using PF 30 Drink Mix and PH 1000 tablets in separate bottles. This provided a large proportion of his sodium intake, with John consuming 1,129mg of sodium per hour at the Belgian Waffle Ride
- John drank ~957ml (~32oz) of fluid per hour and the fact he only had to pee once (while a mechanic spent the best part of 4 minutes fixing John’s broken derailleur ~2 hours into the race) suggests he did a good job of staying hydrated. We’d encourage John to collect some sweat rate data during training so we can get a better idea of his overall losses and optimal level of replacement in different conditions
- Taking into account his overall fluid intake of ~6.65L (225oz), the relative sodium concentration of everything John consumed was ~1,180mg/L. We know from his Advanced Sweat Test results that John loses 1,310mg of sodium per litre of sweat, so he did a solid job of replacing a large proportion of his overall losses in California
- Having said that, John did experience some twinges of cramp during the last mile (“after a punchy technical section and a long coasting descent in the super tuck position, there was one small climb and I felt a twinge of cramp when I tried to go hard to see what I had left”). There are a couple of theories as to why athletes cramp and further testing will be needed to help us try to understand whether John’s cramps are a result of sodium-depletion, muscular fatigue or a combination of the two
Fueling
Quick Carb Calculator Recommendation
30g
carb 30 mins before
60-90g
carb per hour during
- John relied on oats and PF 30 Drink Mix as his main source of fuel during breakfast. He could consider using a more carb-rich breakfast (e.g. porridge, bagels) in future to top up his glycogen stores before the race, although this will always be a matter of personal preference as some athletes find that they struggle to eat on the morning of events
- Having said that, John did a good job of topping up his available carbohydrates during the last 30 minutes before the race started by consuming two chews (again, this final top-up of carbs will come down to personal preference)
- Since we started working with John on his hydration and fueling strategy, we’ve seen him gradually increase his carbohydrate intake during events (his previous 4 races saw him consume ~65g, ~53g, ~72g and ~76g per hour respectively), and he took in an impressive 101 grams of carbohydrate per hour in California
- This is the first time that we’ve seen John consume more than 76g/hr in a race and his intake is well above the 60-90g/hr that the Quick Carb Calculator recommended for a race of this length and intensity
- We’re working with an increasing number of elite athletes who are able to consume more than 90g/hr (albeit John did have a “scary burp” around 1.5 hours into the race) and John has been able to hit these numbers by gradually increasing and trialling his intake during long training rides
- John largely relied on gels, chews and PF 30 Drink Mix to get his carbs on board and, again, this use of different energy products will have been honed over time. The race involved ~88km of off-road riding and “wildly varying terrain”, so John will have tactically timed his fuel consumption when handling the bike was easier
- In addition to his carbohydrate intake, John always opts to use caffeine as part of his race strategy as he’s an athlete who enjoys the performance-enhancing benefits
- The general recommendation is to consume 3-6mg of caffeine per kilogram of body weight, although this will vary from one athlete to the next because we all have different tolerance, sensitivity and metabolic rates when it comes to caffeine. John is an experienced user of caffeine and he exceeded the general recommendations by taking in ~7.08mg/kg - for an event in excess of 5 hours, this is absolutely fine and John has tested this intake during training and found it helps to boost his perceived energy levels
Conclusions
- John had this to say when reflecting on his mechanical-affected race: “I stayed motivated, pedalled hard and brought back several really fast dudes and eventually finished 8th. Top-10 at such a stacked race is a great result, but I knew I could have picked off at least a couple more spots had the mechanical situation been different. Live and learn, I guess.”
- Despite the adversity of his derailleur breaking, John did a great job of maintaining his focus to produce a battling performance and execute a fine fueling plan
- For future races, John might want to dial back his overall fluid intake and focus on preloading with PH 1500 in ~500ml (16oz) of water
Key info
John Borstelmann
Male
77kg
Sweat sodium concentration
1,310mg/L
Sweat sodium classification
High
* determined by a PH Advanced Sweat Test
Result
Position
8th
Overall Time
6:57:43
Normalised power (Bike)
294W
Event information
Sport
Cycling
Discipline
Gravel
Event
Belgian Waffle Ride
Location
California, USA
Date
30th April, 2022
Website
Total Distance
212.0km / 131.7mi
Total Elevation
2,377m / 7,799ft
Race conditions
Weather Conditions
Hot and Humid
Precipitation
No Rain
Min Temp
15°C / 59°F
Max Temp
30°C / 86°F
Avg Temp
24°C / 75°F
Humidity
76%
Athlete feedback
Toilet stops
Yes
Once when I stopped with the mechanical issue
GI comfort
10/10
No issues, although I did have a scary burp early on
Cramping
Twinges but not full-on cramps
John's full stats
Carbohydrate (g) | Sodium (mg) | Fluid (ml) | Caffeine (mg) | Relative sodium concentration (mg/L) | |
---|---|---|---|---|---|
Overall | |||||
Total intake | 699 | 7,847 | 6,650 | 545 | 1,180 |
Per hour | 101 | 1,129 | 957 | 78 |
Data Confidence
1
2
3
4
5
There is good confidence in the accuracy of the data reported. An athlete feels that the numbers closely reflect what they consumed despite a couple of estimations which may carry some degree of error. The majority of what was consumed is recorded to a high level of specificity (most volumes are known through the use of bottles, brands, quantities, flavours). The numbers are very plausible and align with previous data recordings (if an athlete has collected data previously).