Laura Siddall


IRONMAN® World Championships

Laura's headline numbers
Laura's strategy
Fueling
Carbohydrate is the main fuel you burn when racing. Failing to fuel properly is a leading cause of underperformance in longer races.
Laura primarily used gels for her fueling over the course of the race. On the bike she had 14 PF 30 Gels, two PF 30 Caffeine Gels and one PF 30 Chew, which provided over 500 grams of carbohydrate, averaging ~108g of carb per hour. She maintained a strong level of fueling on the run course, alternating between PF 30 Gels and PF 30 Caffeine Gels, as well as getting additional carb from aid station energy drinks. This delivered an average intake of ~107g/h while running and ~99g/h on average for the whole race (34% higher than her intake at Roth). This is a great demonstration of an athlete being able to exceed the 90g/h that was traditionally thought to be a ‘ceiling’. There’s a host of emerging evidence to challenge this theory, and Laura’s intake is just one of many examples.
Hydration
Taking on board an appropriate amount of fluid and sodium is essential to maintaining blood volume and supporting the cardiovascular effort needed to perform on race day.
Whilst the absolute amount of sodium and fluid consumed per hour is important, it’s critical to consider these in relation to each other. This is known as 'relative sodium concentration' and it’s expressed in milligrams per litre (mg/L). How much sodium you’re taking in per litre of fluid is more important than the absolute amount taken in per hour.
Sweat sodium concentration (mg/L) is largely genetically determined and remains relatively stable. Knowing how salty your sweat is enables you to replace a good proportion of your sweat losses, which can range from 200-2,000mg/L.
Whilst Laura’s losses are on the low side, getting her hydration strategy right is still crucial when it’s hot and/or humid as her higher sweat rate in these conditions can result in significant net losses over the duration of a race.
Learn moreLaura had prepared bottles of PH 1500 (Tablets) on the bike, and she also picked up water from aid stations, taking sips and dumping some on her head to keep cool as the temperatures soared. As you can see in this video on Laura’s Instagram page, the intake of fluid from aid stations is hard to approximate when running at such high speeds. From our calculations, she had around 4.1L (139oz) total fluid on the run in Hawaii, which represents a ~48% increase on what she drank during the run at Challenge Roth. This can largely be attributed to the more extreme temperatures in Kona causing Laura to have a higher sweat rate, which in turn meant that she increased her intake to account for higher fluid losses. Laura knows that she isn’t a very salty sweater, so despite achieving an average relative sodium concentration of ~396mg/L (mg/32oz) for the race (which would be potentially problematic for many of athletes in the heat of Kona) she was happy to report absolutely no cramping and an 8 (out of 10) rating for her hydration on the day.
Caffeine
Beyond the Three Levers of Performance (carb, sodium and fluid), caffeine is one of only a few substances that is proven to improve performance for most endurance athletes as it can help stave off mental and physical fatigue.
With a total of ~738mg across the race, Laura likely reaped the physical and mental benefits associated with caffeine. This intake is more than double the general recommendation for caffeine intake during endurance activity of 3-6 milligrams per kilogram of bodyweight, putting her at ~12.1mg/kg. It’s similar to what we saw when analysing her intake from Challenge Roth (11.31mg/kg), and s someone with a clearly high tolerance for caffeine, it isn’t necessarily something she needs to change. To note, there is no need to exceed this though, as no additional benefit has been found.
How Laura hit her numbers
Here's everything that Laura ate and drank on the day...
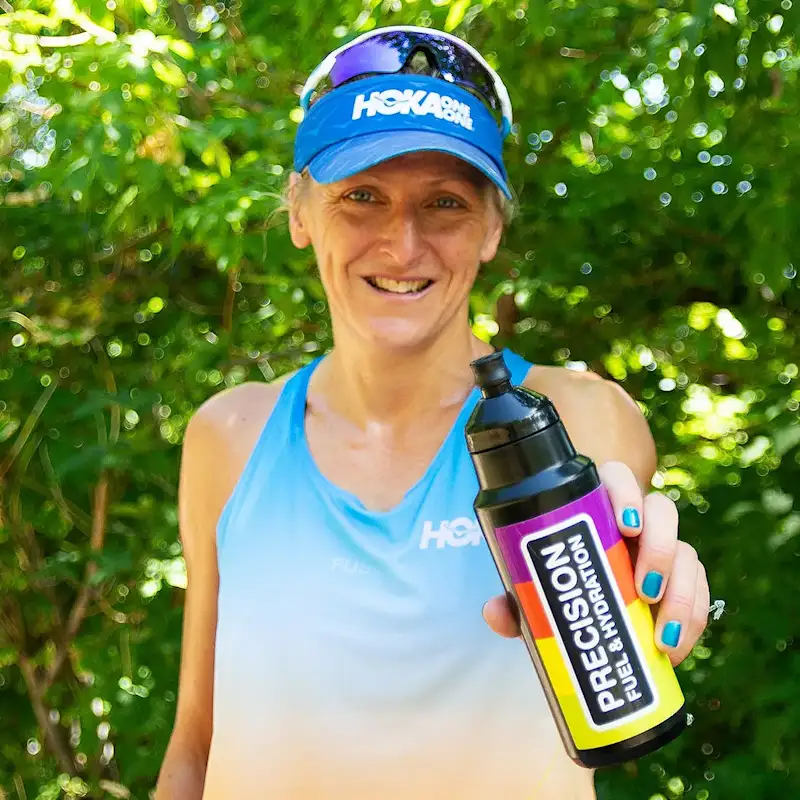
Laura's weapons of choice
Final thoughts
Laura PF&H
PF&HLaura's full stats
Data Confidence?
There is low confidence in the accuracy of the numbers reported. The intake reflects a rough guide to what an athlete consumed but quantities volumes or specific brands might be unknown. It is a loose insight into what the athlete did but the room for error is high-to-very high. This level of confidence most likely reflects the nature of the event (for example an ultramarathon 24 hour or multi-stage event).