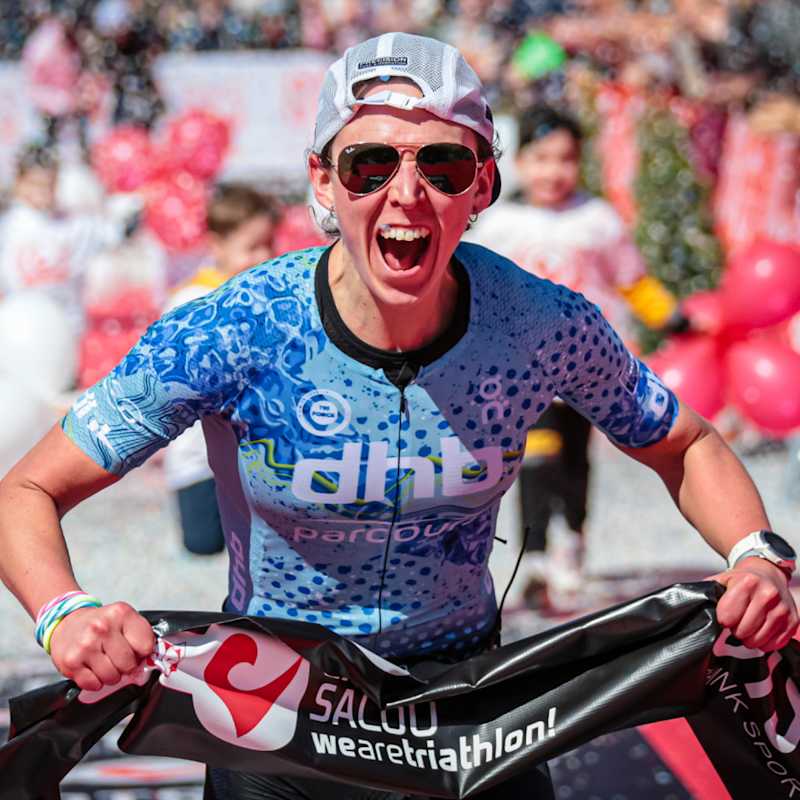
Fenella Langridge
PTO European Open
Fenella's headline numbers
Fenella's strategy
Fueling
Carbohydrate is the main fuel you burn when racing. Failing to fuel properly is a leading cause of underperformance in longer races.
During the bike, Fenella had two bottles filled with a mixture of PF Gels and also took an additional PF 30 Caffeine Gel to further top up her glycogen stores and support her energy levels. This is the highest amount of carb we’ve seen Fenella consume on the bike, perhaps due to the fact that she used the same plan she’d use for an IRONMAN 70.3® which is slightly longer. During the run, Fenella carried two PF 30 Gels with her out of transition and picked up two large cups of cola towards the end. Despite her high overall intake at this race, Fenella reported that her energy levels weren’t as high as she would have liked, especially on the run. Unfortunately, she also suffered from some nausea during the race, which may have been due to the higher carb intake on the bike than she’s used to. It’d be helpful to undergo some more structured gut training during her key sessions at a higher intensity to help to mitigate against this in future races.
Hydration
Taking on board an appropriate amount of fluid and sodium is essential to maintaining blood volume and supporting the cardiovascular effort needed to perform on race day.
Whilst the absolute amount of sodium and fluid consumed per hour is important, it’s critical to consider these in relation to each other. This is known as 'relative sodium concentration' and it’s expressed in milligrams per litre (mg/L). How much sodium you’re taking in per litre of fluid is more important than the absolute amount taken in per hour.
Sweat sodium concentration (mg/L) is largely genetically determined and remains relatively stable. Knowing how salty your sweat is enables you to replace a good proportion of your sweat losses, which can range from 200-2,000mg/L.
Given Fenella’s losses are High (1,331mg/L), nailing her hydration strategy becomes especially crucial when it’s hot and/or humid.
Learn moreFenella paired the plain water she consumed with Electrolyte Capsules to account for her sweat sodium losses. Fenella is a salty sweater, so she usually frontloads her sodium intake on the bike. However, this time her bike intake was significantly lower and as sodium depletion is known to cause muscle cramps, it could potentially explain the cramping in her quads that she experienced on the run. During the run, Fenella’s relative sodium concentration was also lower than normal, as she consumed more fluid in the hot environment to quench her thirst. In future, when she decides to drink more she should pair this with additional sodium intake to make sure she can maintain the optimal relative sodium concentration to match her losses.
Caffeine
Beyond the Three Levers of Performance (carb, sodium and fluid), caffeine is one of only a few substances that is proven to improve performance for most endurance athletes as it can help stave off mental and physical fatigue.
Fenella’s caffeine intake was at the higher end of the scientific recommendations, with the majority sourced from PF 30 Caffeine Gels. As a regular caffeine consumer, this was suitable for her on race day and allowed her to reap the ergogenic benefits that the stimulant offers, supporting her performance and masking some of the fatigue she felt.
How Fenella hit her numbers
Here's everything that Fenella ate and drank on the day...
Fenella's weapons of choice
Final thoughts
Fenella's full stats
Data Confidence?
There is an adequate level of accuracy in the data collected and the numbers reported. The athlete manages to recall what they ate and drank including most specifics (brands flavours quantities plausible estimations of volumes). However there are estimations made within the data which affect the overall confidence level in the data reported.