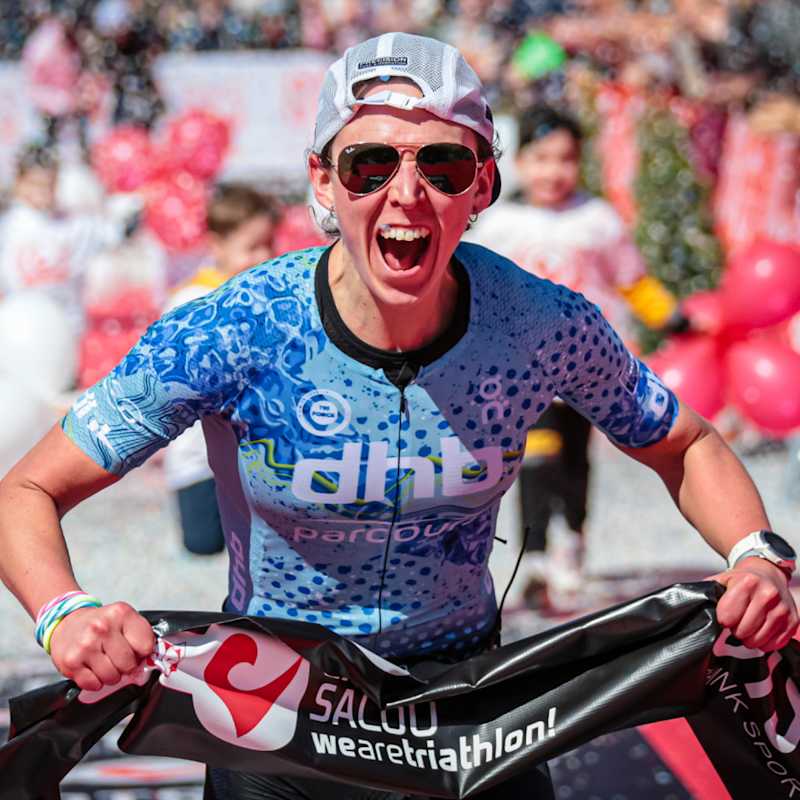
2nd
Fenella Langridge's scorecard
Challenge Roth
Sunday 3rd July, 2022
Within recommended ranges
Just outside recommended ranges
Significantly outside recommended ranges
99g
Carb per hour
984mg
Sodium per hour
814ml
Fluid per hour
1,210mg/L
Relative sodium concentration
8.95mg/kg
Caffeine per bodyweight
How Fenella hit those numbers
How Fenella's hydration and fueling went...
- Fenella had her best full-distance race performance to date at Challenge Roth, executing her bike power and run pace exceptionally to finish 2nd, almost 15 minutes ahead of 3rd place
- As temperatures rose throughout the race, Fenella had planned her fueling and hydration strategy for this exact scenario, and executed it well to crush her full-distance PB and finish just 36 seconds outside of the magic 3-hour marathon mark
- Fenella made sure to enjoy every second of this iconic race by smiling and waving to the crowds on the bike and high-fiving supporters on the run. She said “the race was amazing, it’s such a cool experience and I loved the support from the crowd” but emphasised how much fueling and particularly hydration played a role between those who performed well and those who didn’t
Hydration
- Fenella ensured she started the race optimally hydrated by preloading with 1L/32oz x PH 1500 Tablet and 750ml/24oz x PH 1500 (Drink Mix) in the hours before the start. Whilst this isn’t our usual recommendations for an optimal preload (i.e. 1 x ~500ml/16oz PH 1500 the night before and the morning of the race), we’ve seen Fenella utilise this strategy effectively in previous races where temperatures were expected to be hot
- In the first 5km of the bike, Fenella dropped one of her two 750ml/24oz bottles containing a PF 90 Energy Gel, one PH 1500 (Tablet) and one PH 1000 (Drink Mix). Fortunately, Fenella’s partner and coach Billy was able to recreate a similar drink with one PF 90 Gel and one PH 500 (Drink Mix) and hand this to her mid race
- Fenella also carried two 750ml/24oz bottles which had one PF 90 Gel and two PH 1500 (tablets). Whilst mixing electrolytes and carbohydrates isn’t something we normally recommend, we have seen Fenella and a number of other athletes use this strategy successfully on several occasions
- In total, Fenella drank ~6.93L/243oz across the whole race which split into ~3.05L/103oz on the bike and ~3.88L/131oz during the run. This was the first time we’ve seen Fenella take on more fluid whilst running than on the bike, which is likely due to the rapidly rising temperatures she experienced during the marathon, and not wanting to dehydrate or overheat
- Furthermore, Fenella’s fluid (~814ml/27oz per hour) and sodium intake (~984mg/h) at this race were considerably higher than the last time she raced in Roth, where she averaged ~662ml/23oz and ~584mg/h per hour respectively
- Fenella’s intake of sodium throughout the race was ~8,383mg which in relation to her fluid intake gave her a relative sodium concentration of ~1,210mg/L. Considering Fenella’s high sweat sodium concentration of 1,331mg/L, she will have replaced a large proportion of her losses. She described a couple of occasions on the run where she tried to take an Electrolyte Capsule without any water and wasn’t able to, but thankfully her solid intake on the bike (~1,743mg/L) will have prevented her sodium levels dropping too much
- During the marathon, Fenella drank an impressive ~3.8L/128oz of fluid (1.29L/43oz per hour) as she battled to stay hydrated and regulate her body temperature whilst running alongside a canal which she described as “like running in an oven”
- She was able to utilise personalised pick-up points during the run and grabbed a ~300ml/10oz bottle of concentrated PH 1500 on two occasions, managing to drink ~200ml/6.7oz from each bottle. Fenella felt these were essential late on in the race, giving her the sodium hit she needed to keep running hard
- Fenella kept herself as cool as possible by regularly tipping cups of water over her head at several aid stations on the bike, and at every aid station on the run
Fueling
Quick Carb Calculator Recommendation
30g
carb 30 mins before
60-90g
carb per hour during
- Fenella had her usual cup of rice and some white bread with jam for breakfast, giving her glycogen stores a final top off
- About 45 minutes before the start, Fenella had a PF 30 Energy Gel following advice given to her by Supersapiens to avoid a drop in glucose during the swim. She backed this up by taking a PF 30 Caffeine Gel ~15 minutes before the start, to get some circulating glucose in her system and save as much stored glycogen as possible for later in the race
- In terms of carb intake throughout the race, Fenella averaged an impressive ~99g/h, including the 51 minutes she was swimming, so actually hit ~104g/h on the bike and ~111g/h on the run. These are the highest carb numbers we’ve seen Fenella hit, impressively averaging 29g/h more than her last full distance race at the IM World Champs
- Last time Fenella raced Challenge Roth in 2021 she consumed ~57g/h during the run and faded quite a lot during the second half of the marathon, so it’s great to see her crushing the latter part of this race, and keep taking on carbs right until the end. Fenella mentioned she had “no major lows in energy” and managed to average the same bike power for the first and second halves of the bike which is very impressive
- This supports the recent evidence which suggests that athletes taking in excess of 90g/h of carbs can see significant performance improvements compared to those taking lower quantities. It’s worth noting that Fenella has spent considerable time training her gut to absorb more carbs, and this training shouldn’t be overlooked
- Fenella regularly uses caffeine to help boost her performance, and along with her PF 30 Caffeine Gel she took before the start, she also had two more caffeine gels on the bike, and two on the run. Combined with some cups of Coca Cola during the run, her total caffeine intake was ~510mg (8.94mg/kg). Whilst this is slightly above the recommended range for a race of this duration 3-6mg/kg (1.4-2.7mg/lb), perhaps Fenella’s habitual caffeine intake has increased her tolerances, and we’ve seen her hit similar numbers in her past races with no ill effects
- Fenella was sick immediately after crossing the finish line, but put this down to digging incredibly deep in the final kilometres as she was striving to dip under 3 hours for the marathon, but fell an agonising 36 seconds short. This coupled with the high temperatures (~32℃/ 90℉) by the time she finished, might have caused the sickness, but she recovered almost immediately and had no other side effects
Conclusions
- Fenella raced hard for the whole race, and ultimately executed her most successful full-distance triathlon to date, one-upping her 3rd place from last year’s Challenge Roth
- This is the highest amount of carbs we’ve seen Fenella hit across the whole race (~99g/h), and although she experienced some burping during the race, she rated her GI comfort 10/10 suggesting she was comfortably hitting these numbers
- Racing well in the heat is something Fenella has focused on with the team at PF&H, and this race was another great example of how she’s nailing her fuel and hydration strategy
Key info
Fenella Langridge
Female
57kg
Sweat sodium concentration
1,331mg/L
Sweat sodium classification
Very High
* determined by a PH Advanced Sweat Test
Result
Position
2nd
Overall Time
8:31:41
Swim Time
0:51:44
Bike Time
4:35:41
Run Time
3:00:36
Event information
Sport
Triathlon
Discipline
Full distance
Event
Challenge Roth
Location
Roth, Germany
Date
3rd July, 2022
Website
Swim Distance
3.8km / 2.4mi
Bike Distance
180.2km / 112.0mi
Run Distance
42.2km / 26.2mi
Total Distance
226.2km / 140.6mi
Race conditions
Weather Conditions
Hot
Precipitation
No Rain
Min Temp
25°C / 77°F
Max Temp
32°C / 90°F
Avg Temp
28°C / 82°F
Humidity
52%
Athlete feedback
Race Satisfaction
9/10
Energy levels
10/10
Toilet stops
Yes
Once on the bike and once on the run
GI comfort
7/10
Cramping
No cramping
Fenella's full stats
Carbohydrate (g) | Sodium (mg) | Fluid (ml) | Caffeine (mg) | Relative sodium concentration (mg/L) | |
---|---|---|---|---|---|
Overall | |||||
Total intake | 841 | 8,383 | 6,930 | 510 | 1,210 |
Per hour | 99 | 984 | 814 | 60 | |
Bike and Run | |||||
Total intake | 811 | 8,383 | 6,930 | 410 | 1,210 |
Per hour | 107 | 1,105 | 914 | 54 | |
Bike | |||||
Total intake | 478 | 5,316 | 3,050 | 200 | 1,743 |
Per hour | 104 | 1,160 | 665 | 44 | |
Run | |||||
Total intake | 334 | 3,067 | 3,880 | 210 | 790 |
Per hour | 111 | 1,022 | 1,293 | 70 |
Data Confidence
1
2
3
4
5
There is an adequate level of accuracy in the data collected and the numbers reported. The athlete manages to recall what they ate and drank including most specifics (brands, flavours, quantities, plausible estimations of volumes). However, there are estimations made within the data which affect the overall confidence level in the data reported.